Review logs and diagnose failures
OpenConnector records every outbound call, every endpoint hit, every synchronization run and every job tick in dedicated log views. The logs are the first place to look when something fails in production — they preserve the full request and response, including timing and status codes.
Goal
By the end you will know where each kind of log lives, how to filter to the failures that matter, and how to read a single log entry to identify the root cause.
Prerequisites
- You have at least one Source, Endpoint, Synchronization or Job that has been exercised — logs only contain rows from real activity.
- You are an administrator on the Nextcloud instance, or your user has been granted the OpenConnector configuration role.
Steps
-
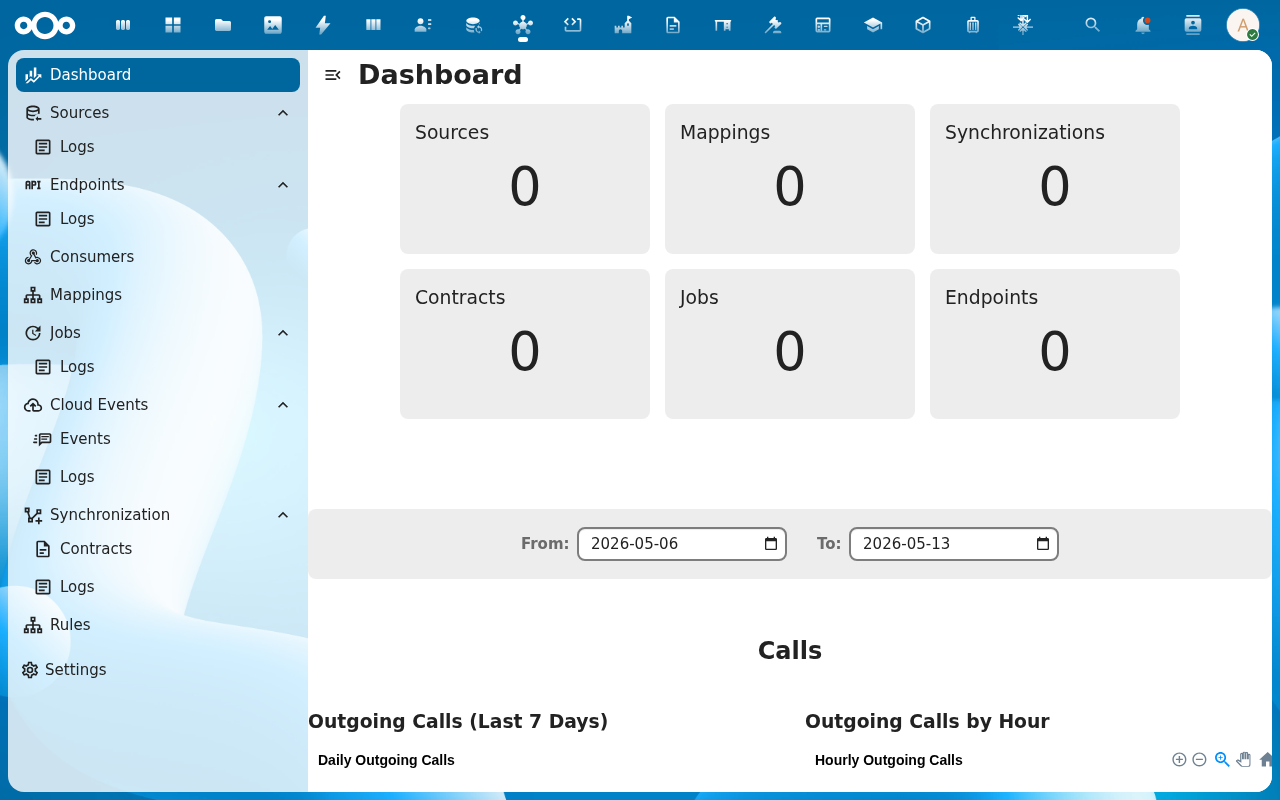
Open the OpenConnector navigation. Each major concept has its own Logs sub-entry: Sources → Logs, Endpoints → Logs, Synchronization → Logs, Jobs → Logs, Cloud Events → Logs. The split keeps the noise down: a flaky source doesn't bury a misbehaving endpoint.
-
Open Sources → Logs. The default list shows the most recent calls across all sources, status code, response time, and the source they belong to. Use the filters above the table to narrow by status (e.g.
>= 400), source, or time range.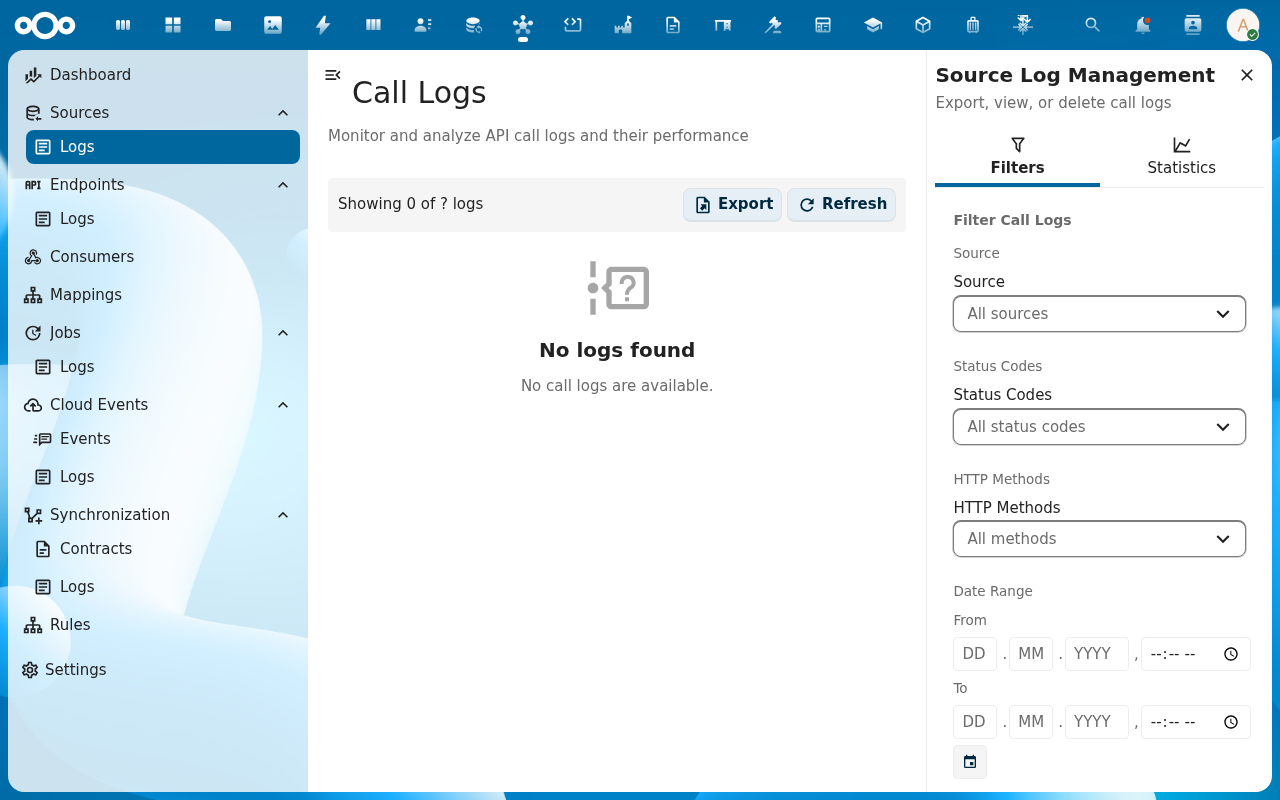
-
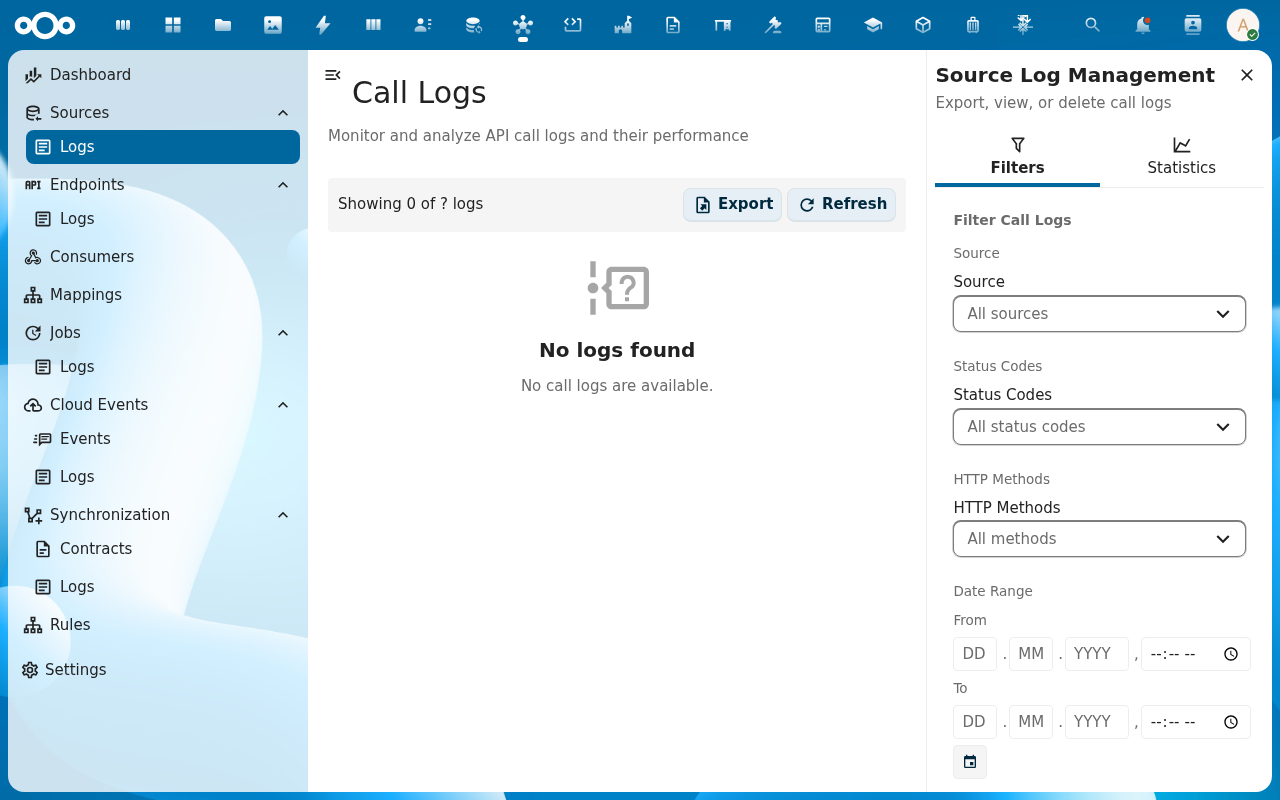
Click one error row to open the detail view. The detail pane shows the full Request (URL, headers, body) and the full Response (status, headers, body) side-by-side, plus timing and the source / sync / job that triggered the call.
-
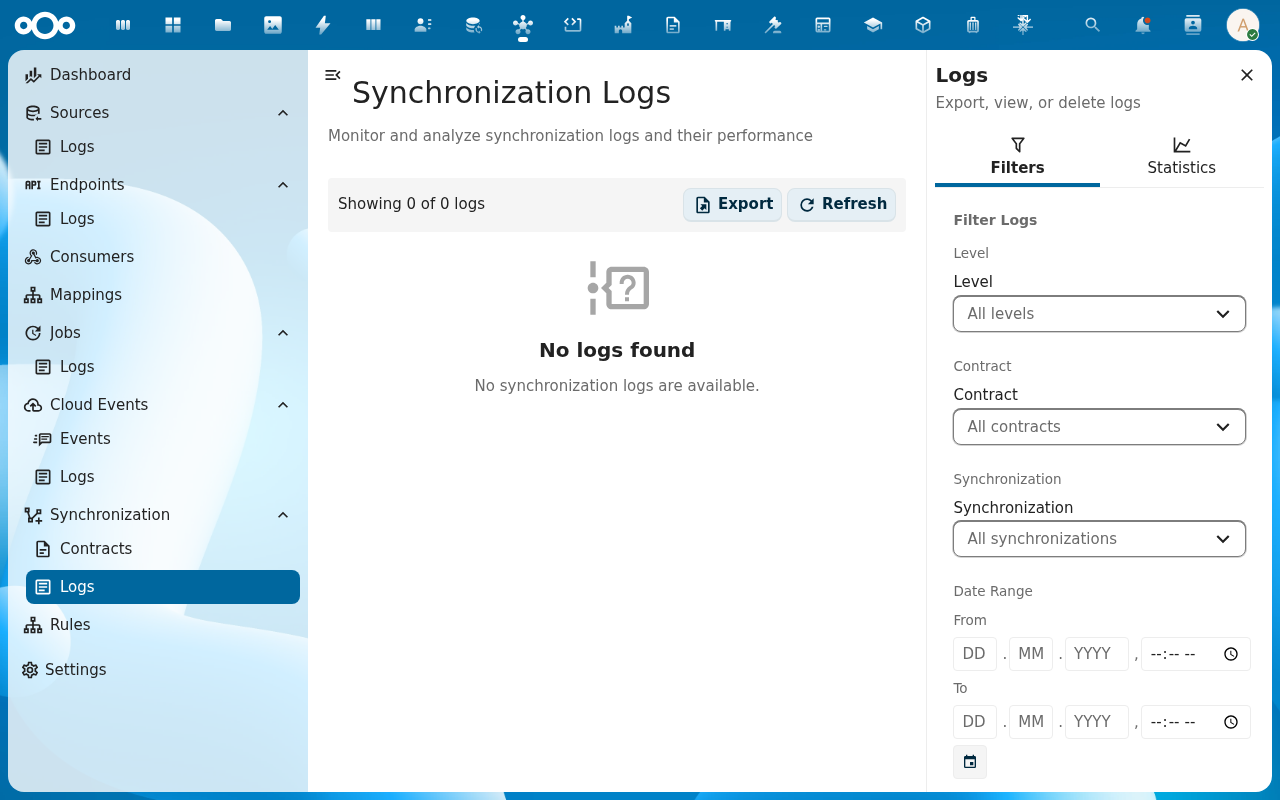
Move to Synchronization → Logs to see runs at the synchronization level. Each row summarises one run — fetched / new / changed / unchanged / deleted / errored. Drill in to see the per-object contracts that the run created or updated.
-
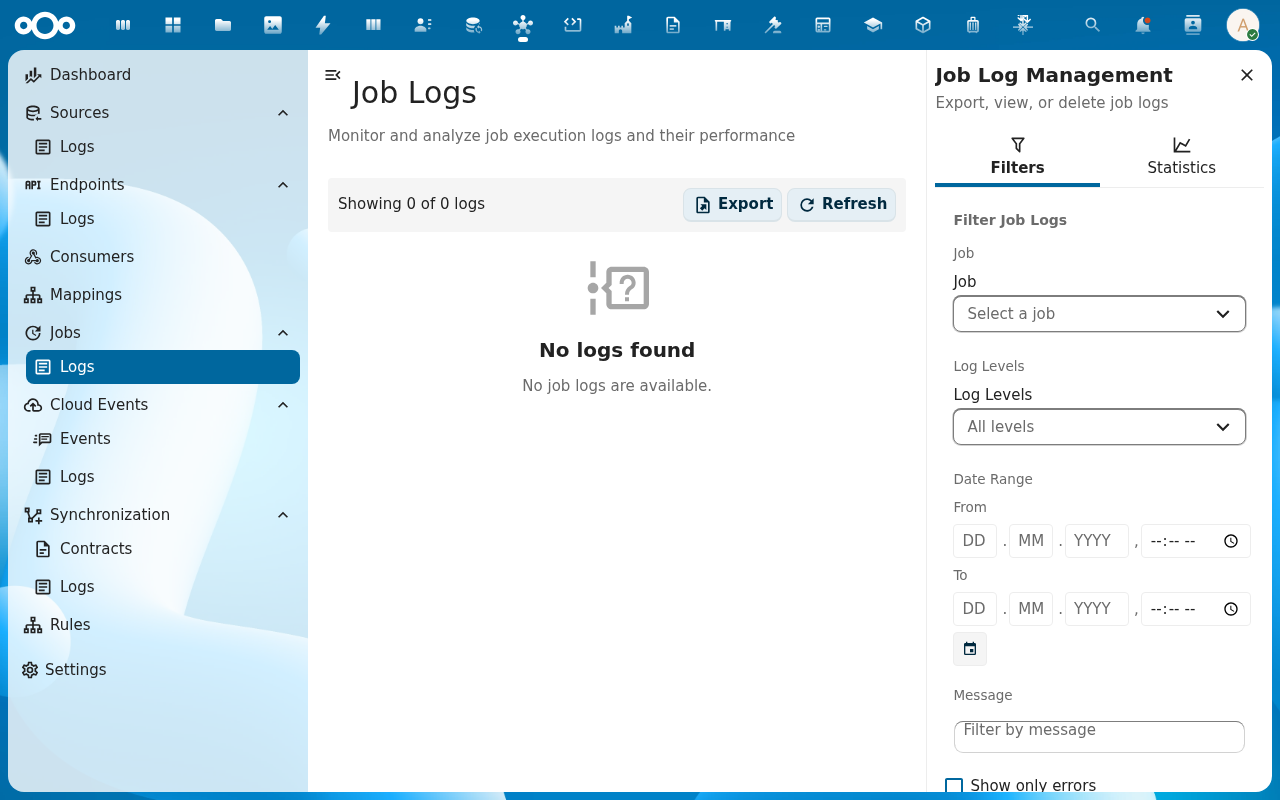
Move to Jobs → Logs to see the same data from the job angle. A job tick groups all sub-runs (typically one synchronization) and reports the cumulative status and duration. Useful for confirming the schedule is actually firing.
Verification
You are done when: you can navigate to a specific failed call from any of the four log views, open its detail pane, and identify the upstream cause — wrong path, bad credentials, response shape mismatch, timeout.
Common issues
| Symptom | Fix |
|---|---|
| Logs are empty even though I know calls have happened | The instance is configured with a short log retention. Check Settings → OpenConnector → Log retention (admin) and raise the window if needed. |
| A failure shows in Source Logs but not in Synchronization Logs | The sync's conditions filter excluded the failing object before the call was made — the source log is still recorded because the call went out, but the sync layer didn't process it. |
| Detail view shows an empty response body | The source returned an empty body (e.g. on a 204 No Content), or the body exceeds the configured log-body size limit and was truncated. |
Reference
- Logging feature — full reference for the log model: tables, retention, body limits.
- Synchronizations — process flow — what each phase of a sync run records.